
The purpose of this post is to outline 3 lines of evidence from the field of human genetics that clearly demonstrate that the slow accumulation of mutations over generations is responsible for the genetic diversity of modern human populations, and that the same process is responsible for the genetic differences we have compared with chimpanzees, affirming the fact that we share a common ancestor.
This post began life as a few paragraphs in my (upcoming) review of chapter 8 of Nathaniel Jeanson’s book “Replacing Darwin”, but as it grew to be more comprehensive I decided it really deserved its own dedicated post. My plan is for this to be able to stand alone as an interesting article in its own right, but I’ll also include a few words on the relevance to Jeanson’s claims in his book for the benefit of those coming to this post from my book review, as well as some background information that will overlap with the review post.
In his book, Jeanson advocates for a model that has gained some traction in “creation science” circles in recent years, representing an attempt by creationists to explain the extensive genetic diversity in modern populations. Put simply, they recognise that there is far too much genetic variation in most species (and especially between the many species within “kinds”) to be explained by just a few thousand years worth of mutations at current mutation rates. Their explanation? That the original members of each “kind” (Adam and Eve for humans) were originally created with a huge amount of variation already present in their genomes, in the form of extensive heterozygosity which has since been spread into modern populations.
As you might imagine, there are quite a few problems with this radical suggestion. Since Jeanson and other creationists tend to focus on humans, here I’ll focus on a few lines of evidence from human genetics that clearly contradict their new hypothesis. This list is by no means exhaustive, I just chose what I consider to be some of the most obvious examples.
Background
This will be a quick primer on human genetics. Humans are diploid organisms, meaning that we have 2 copies of each of our chromosomes. We have 23 pairs of chromosomes, for a total of 46. 44 of these chromosomes are called the autosomes, leaving the 2 sex chromosomes, X and Y. These 46 chromosomes are contained in the nucleus of human cells, and it’s this nuclear DNA that I’ll be focusing on in this post, primarily the autosomes. Humans (and other Eukaryotic organisms) also possess a small amount of DNA in the mitochondria, but I won’t discuss that here. Each chromosome is comprised of long sequences of DNA – chains of 4 nucleotide “bases”: adenine, thymine, cytosine, and guanine. Throughout this post, these nucleotides will be abbreviated to A, T, C, and G, respectively.
Since we have 2 pairs of each chromosome in each cell (one inherited from each parent), we have 2 copies of each sequence in that chromosome – 2 copies of every gene. For the most part, these sequences are identical, but there are also small differences because of mutations. Most of these are inherited from the parents, but each new offspring also is conceived with ~100 new single nucleotide mutations and a few insertion/deletion mutations. As a sequence, or even a specific position in the genome, changes due to mutations, different “versions” of this sequence/position are produced. These different “versions” are called “alleles”. I might have 2 copies of allele A of sequence or gene X, while you might have 1 copy of allele A and one copy of allele B, or 2 copies of allele C.
Locations in the genome for which different alleles exist in the population are called single nucleotide polymorphisms, or SNPs for short. If 20% of people have a G at a particular site in their genome, and the other 80% have a C, this site is polymorphic. If all humans have a T at a particular position in the genome (T allele at site X), then a child is born with a G at that position instead (G allele at site X), the T represents the “ancestral” allele of that base, while the G represents the “derived” allele. The same applies over evolutionary time.
With all this in mind, let’s get into the first line of evidence.
1. Ancestral alleles
A simple way to determine what the ancestral state of an allele was in the human species is to look and see what the state is in chimpanzees. For example, looking at a particular site in the human genome, we might find that 2 variants exist in humans, one population has a T there, the other a G. Looking at chimps, we might find that they all have a G in the corresponding position. In this case, we can say with some confidence that G was the ancestral state of that site, meaning that the ancestor of both humans and chimps had a G at this site in their genome, and that the human population #2 with the T experienced a mutation from a G to a T sometime after they split from the other human population (#1)
Of course, there are various confounding circumstances that could mess up this neat version of events: the ancestral state might have been T, but both population #2 and chimpanzees independently mutated that T into a G. That’s absolutely possible, but when you crunch the numbers it turns out that these kinds of more contrived versions of events are pretty rare, introducing an error rate of just a couple of percent into the analysis. So, the fixed chimp state of an allele is a fairly good proxy for the ancestral human state. Even better methods to estimate the ancestral state involve looking at multiple outgroups instead of just one (for example chimps, gorillas, and orangutans, instead of just chimps) and/or use a more probabilistic approach to the data based on realistic substitution models, among other things (Park, 2015; Keightley and Jackson, 2018).
Let’s stop and think about the implications of this for human populations, and what might be predicted about human allele frequencies based on this premise that includes evolution from a common ancestor with chimps. If most mutations that occurred in the human lineage between our common ancestor with chimps and today were neutral, then most of them would remain at pretty low frequencies in the population. After all, the mutation (new allele) is initially present in just a single individual, and then can only spread to a greater number of people by being passed onto a greater number of children over many generations.
If we examine human genomes and find that 10% of people have a C in a particular site, and that 90% of people have a T in that site instead, it’s more likely that the ancestral state for that site was the T, and that a mutation to a C increased in prevalence to 10%, than it is that the ancestral state was a C and a mutation to a T increased in prevalence to 90%. To quote the chimpanzee draft genome paper (Mikkelsen et al., 2005) (my emphasis):
“An elegant result in population genetics states that, for a randomly interbreeding population of constant size, the probability that an allele is ancestral is equal to its frequency.”
This mathematical result is solid, and modern allele frequencies can be ascertained empirically by surveying populations. So, if the scenario in the mathematical model is approximately true in reality – basically that human genetic variation is the result of mutations occurring and drifting in a population – and the chimp allele states are a good proxy for the ancestral state of an allele (as expected by the model of common ancestry and evolution), then we’d expect to see a strong correlation between the frequency of an allele and its probability of representing the ancestral state.
To flip that around and simplify it a little, if we find such a correlation, it supports the premises of human variation arising as a result of mutations occurring in a population and humans sharing close common ancestry with chimps. So, do we find such a correlation? Yes. Figure 1A plots the results of an analysis of ~120,000 variant sites in 3 human populations: West Africans, Europeans, and Asians. As you can see, there is a strong positive correlation.
Interestingly, the West African variants (green) show an almost perfect correlation with a slope of ~1 (“the probability that an allele is ancestral is equal to its frequency”), while the European (red) and Asian (blue) variants have slightly flatter, more horizontal trend lines. The reason for this is that population bottlenecks increase the speed at which neutral alleles spread in a population, causing the high-frequency alleles to be a little less likely to be ancestral (since more derived (mutant) alleles now have higher frequencies too), and making the corresponding low-frequency alleles slightly more likely to be ancestral. This has the effect of lowering the points towards the right of the graph and raising the points towards the left of the graph, resulting in a flatter slope.

Figure 1B shows the result of a subsequent analysis of over 600,000 variant sites from 51 human populations by Li et al. (2008), this time using very different axes to show a similar, but more detailed result than 1A. Each point represents one human population. On the Y-axis is the steepness of the “slope” for that population: the same kind of slopes as those depicted in Figure 1A (slightly different measure, same principle). Basically, the higher up on the graph the point is, the steeper the allele slope (closer to 1) of that population is, and the lower a point is, the flatter the slope is. On the X-axis is the distance from Addis Ababa, the capital of Ethiopia in East Africa, so what this graph is showing is that as human populations get further away from Ethiopia, they have flatter ancestral allele frequency slopes. As I said before, flatter slopes are a signature of population bottlenecks in the past, so what this graph (and Figure 1A) shows is that human populations diversified out of (East) Africa in a series of successive bottleneck (migration) events.
So, by analysing the frequency of alleles in modern human populations and making comparisons with chimps to determine ancestral states, we can not only cross-confirm mathematical models with biological reality regarding mutations and common descent, but we can also independently derive evidence for an African origin of humanity.
2. Mutation spectra
I’ve already mentioned that there are different types of mutations. Insertion and deletion mutations happen, but by far the most common type of mutations are the single-nucleotide mutations, where through one process or another, a single DNA base-pair is changed. You can see in Figure 2 that the molecular structure of the bases adenine (A) and guanine (G) are similar, both consisting of 2 “rings”. Cytosine (C) and thymine (T), on the other hand, consist of just a single ring. A and G are known as “purines”, and C and T are “pyrimidines”. When a purine is mutated to the other purine (A to G or G to A), or a pyrimidine is mutated to another pyrimidine (C to T or T to C), this mutation is classified as a “transition” mutation. When the type of base is changed from a purine to a pyrimidine (e.g. A to T), this is called a “transversion” mutation. We can consider these to be the 2 major classes of single-nucleotide mutations. Within these classes, we can categorise each specific type of mutation, separating out the “A to G” mutations from the “G to C” mutations from the “T to C” mutations, etc. As there are 4 nucleotide bases in total, and a mutation involves changing from one base to a choice of 3 others, there are 4×3=12 possible types of mutations (arrows, Figure 2). However, since the genome is comprised of complementary base-pairs, the end result of a C to T mutation on one strand looks exactly the same as a G to A mutation on the other strand (since C is complementary to G, and T is complementary to A). this cuts then number of mutation types that we can look for in half, to 6.

Different types of mutations occur at different frequencies. Transitions occur at different frequencies than transversions, and within these categories we can specifically say that, for example, C to T mutations happen at a different rate than A to G mutations, or G to T mutations happen at a different rate than A to C mutations. These rates differ because of their different biochemical proclivities for being mutated, and also how likely the change is to be recognised by the DNA repair machinery and corrected. I won’t get into the details here, but the important point is the fact that different types of mutations happen at different rates, and that these rates can be worked out by simply counting mutations that happen between parents and children and tallying up the different types. The final result can be presented as a spectrum: a bar chart with the types of mutations on the x-axis and their frequencies on the y-axis.
We can also examine the genomes of members of a population, count up all the different genetic variants (alleles) within this population, and produce another graph of the spectrum of variation. If mutations were responsible for the variation within the population, then we’d expect this spectrum to approximately match the one based on mutations directly measured between parents and children. If C to T mutations are empirically the most common between parents and children, we’d expect to find that most variants in the population represent C to T mutations, for example. On the other hand, if a significant portion of the variation in the population was caused by an entirely different process, like divine creation, then there are no constraints on the spectrum of differences that might have been created. It seems likely that whatever the extent of diversity God might have intended to create in Adam and Eve, this spectrum of created differences would bear little resemblance to the spectrum of mutations observed in the course of modern human reproduction.
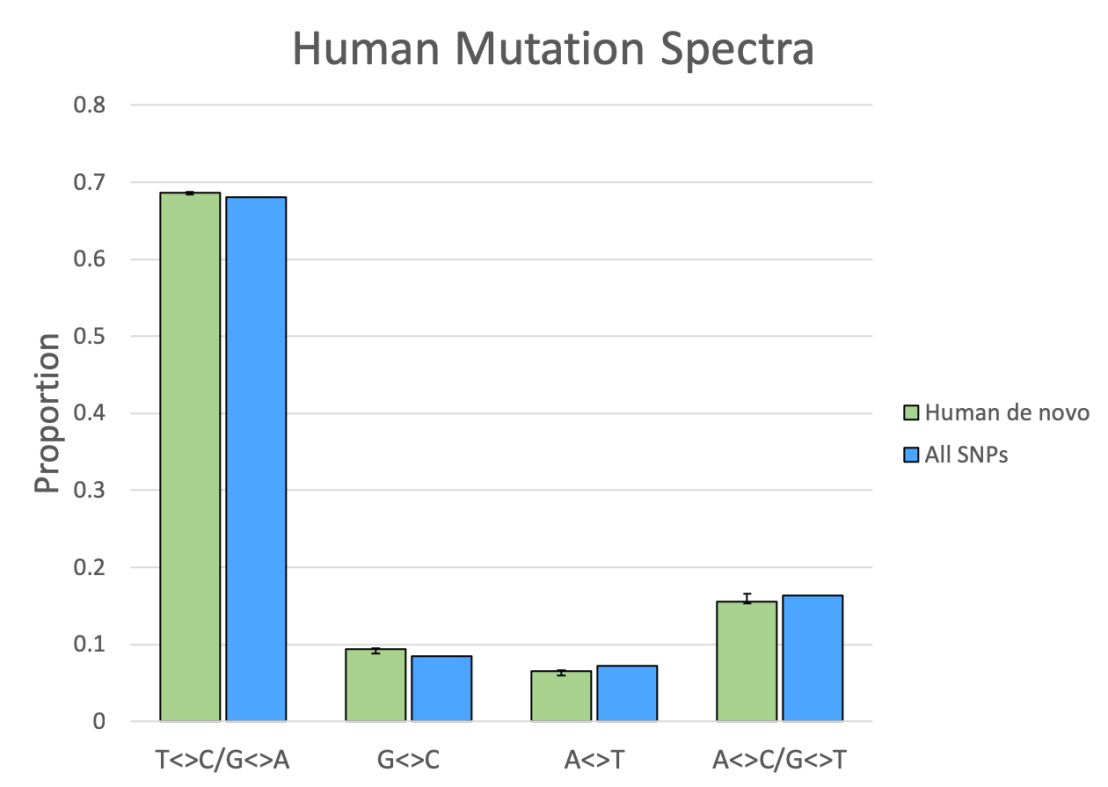
So, using this simple test, we can determine whether variation within a population was the result of mutation or not. I gathered de novo mutation data from 3 recent studies that sequenced parent-offspring trios to find new mutations: Francioli et al. (2015); Wong et al. (2016); and Halldorsson et al. (2019) (which was itself an extension of Jónsson et al., 2017). Smith et al. (2018) conveniently compiled the results of Francioli, Wong, and Jónsson et al. Between them, they identified about 220,000 de novo autosomal single-nucleotide mutations that occurred between parents and offspring. The proportions of these mutations is shown in Figure 3 as weighted averages (green bars). For human variation data, I went directly to the publicly available 1000 Genomes Project data archive, where they’ve documented over 84 million SNPs present in humans from populations around the world. Isolating just the biallelic SNPs (sites which are present in just 2 states (alleles) within the human population), I was left with about 78.6 million SNPs. This spectrum of SNPs also matches the spectrum of 8.4 million SNPs analysed by Park (2015; Table 2 – All), further confirming my results.
Do the spectra match or not? I think Figure 3 speaks for itself.
Of all the SNPs, the vast majority of variants, about 72.6 million, are found at relatively low frequency in humans (<20%). To make sure that these didn’t bias the spectra of the higher-frequency SNPs, I decomposed all the SNPs into 5 frequency bins, and plotted their results separately (blue bars, Figure 4). As you can see, the match between the de novo spectrum and the SNPs remains pretty consistent between the different bins.
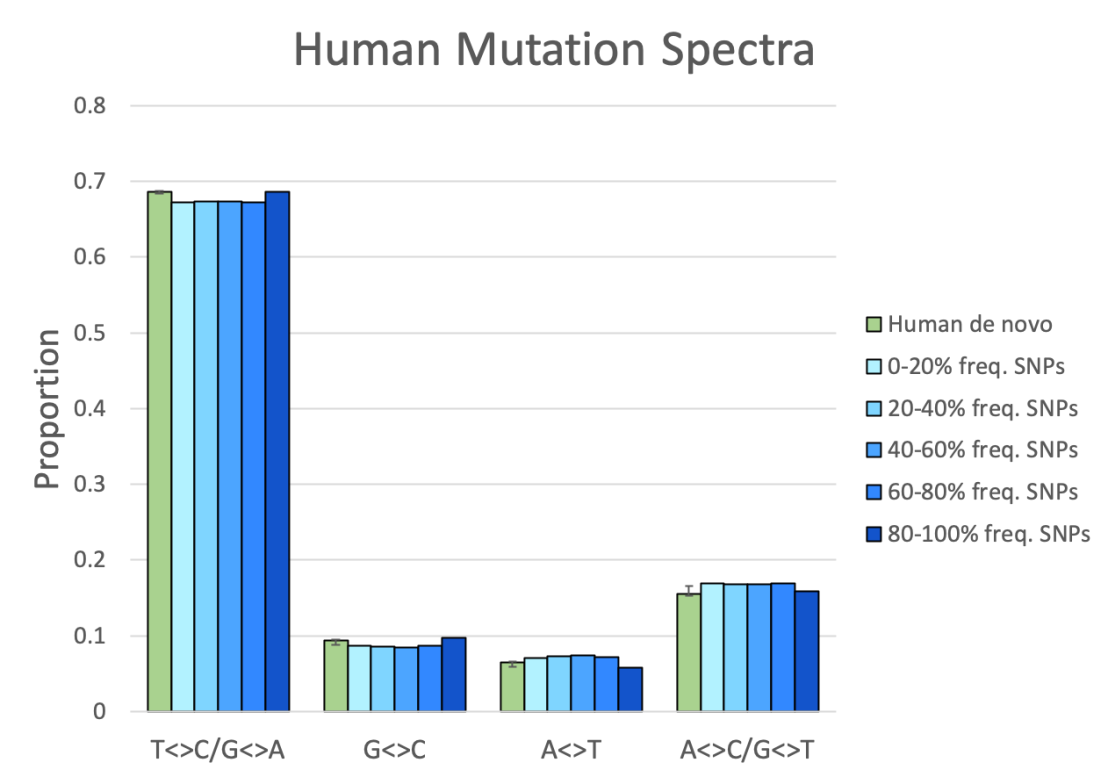
This is strong evidence that mutations, the observed phenomena that are responsible for the de novo nucleotide differences (green bar), are also responsible for human genetic variation at all frequencies.
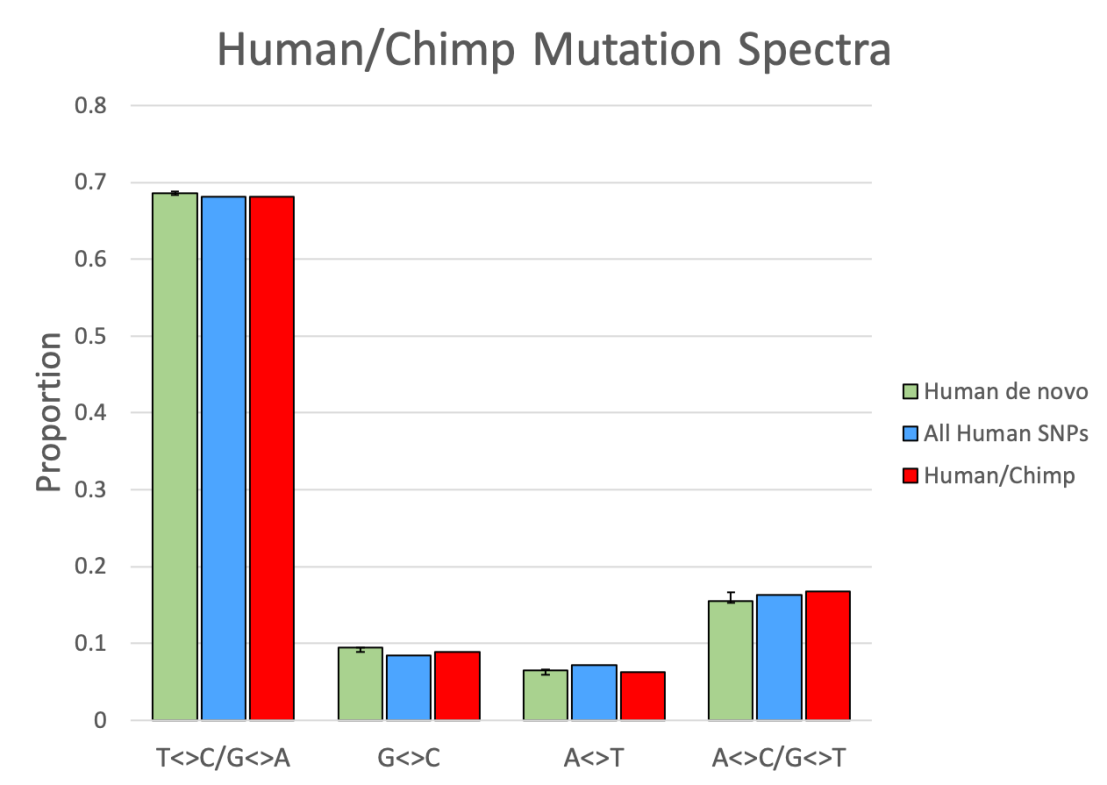
We can do a similar comparison between species. Count up all of the fixed nucleotide differences between species and then calculate the spectrum of these types of differences, and then compare this to the spectrum of differences within just one of the species, or the spectrum from new mutations arising in one of the species species. The same logic applies as before. If mutations are responsible for the differences between species, then the spectra should match. If a process other than mutation is responsible, like divine creation, then there’s no reason to expect such a pattern. What do we see? Well, once again I downloaded public data, generated by Prado-Martinez et al. (2013), extracted all 17.6 million sites where there appeared to be a fixed single-nucleotide difference between humans and chimpanzees, and counted up what kind of differences they were.
Figure 5 demonstrates that the spectra obtained from this human/chimp comparison (red bars) matches that of human de novo mutations and human genetic diversity. Similar matching spectra were found as early as 2002 using a smaller set of DNA sequences, as this was before whole genomes were available (Ebersberger et al., 2002).
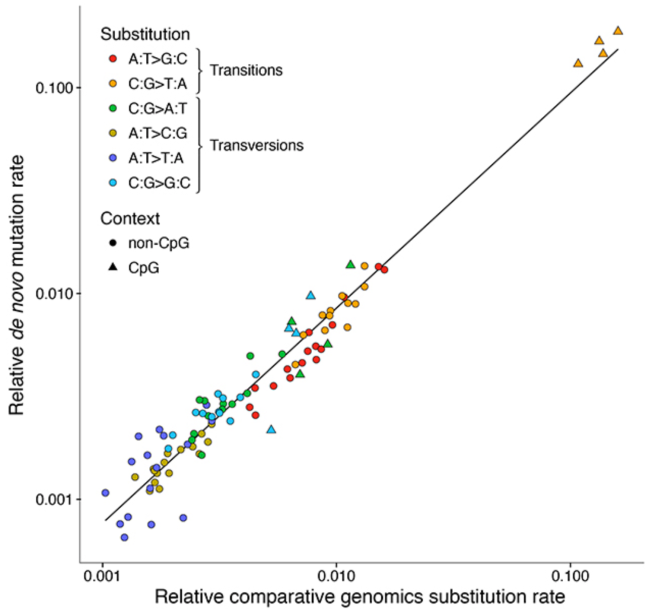
Another way to present the match between these data is to plot the relative rates of mutation types observed in sets of mutations observed between parents and children (de novo mutations) against the rates inferred from comparisons between species. As you can see in Figure 6, reprinted from Francioli et al. (2015), there is an excellent correlation from these independently obtained rates. I mentioned that there were just 6 distinguishable types of mutations earlier, but technically they can be further split up depending on the context of the nucleotides that surround them. For example, a mutation from a C to T when that C is flanked on either side by a G (GCG to GTG), is different from a mutation from a C to a T when that C is flanked on either side by an A (ACA to ATA). When accounting for all these possible combinations of flanking nucleotides (“trinucleotide contexts”), 6 types of mutations can be split up into 6*(4*4)=6*16=96 types. That’s what is shown by the many points in Figure 6. The triangles represent those instances where the trinucleotide context includes a “CG”, such as “ACG” or “CGT”. You can see that C to T mutations in this so-called “CpG” context are by far the most common single-nucleotide mutation, relative to the number of available sites.
It’s not just humans and chimps, either. We can perform multiple pairwise comparisons between primates, and even between more distantly related species like cats and dogs, and consistently see the same pattern. Visit Dr. Steve Schaffner’s Biologos article to the results of these comparisons, and read a more eloquent and read a more eloquent explanation of this subject that mine above (see footnote).
Of course, these spectra don’t match perfectly – nothing in biology is so clear cut. Even different human populations have slightly different mutational spectra. Mutation rates do evolve, after all, and this affects the relative rates of the different types of mutations. In fact, mutation spectra actually get slightly more dissimilar between species as the divergence between them increases. For example, the human and chimp spectra are more similar than the human and gorilla spectra, and the human, chimp, and gorilla spectra are more similar to one another than the human and orangutan, or gorilla and orangutan, spectra are (Harris and Pritchard, 2017). Once again, this familiar nested hierarchy pattern emerges from the data, consistent with the prevailing view of the ancestry of humans within the great apes.
3. Divergence patterns
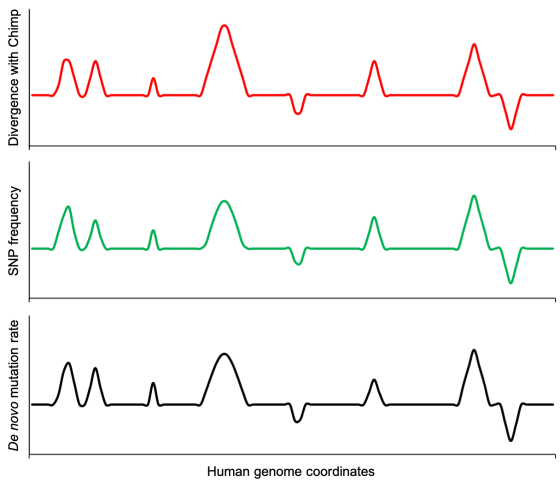
If mutations are the cause of intra-species diversity and inter-species differences, then we would expect there to be a correlation between the locations of observed de novo mutations and the variation within and between closely-related species. In other words, genomic regions observed to have elevated mutation rates should display increased diversity within a species and also increased divergence between species.
A simple example of this is the entire Y-chromosome. This chromosome mutates faster than the other chromosomes, and so as we might expect, the human and chimp Y-chromosomes are more dissimilar than the other chromosomes (Kuroki et al., 2006). This is consistent with the greater number of mutations causing the increased divergence.
What about at the finer scale – looking at a higher resolution that the chromosome-level? Using a dataset of over 140,000 de novo mutations from 3 pedigree studies, Smith et al. (2018) identified where those mutations occurred to quantify how the mutation rate varies in different parts of the genome. When they compared this data to SNP data from the 1000 genomes project representing genetic variation found within humans, they found that there was a significant positive correlation between the observed rate of mutation in a genomic position and the number of SNPs. There was a similarly significant correlation between the observed rate of mutations and sequence divergence between humans and chimps. Human genomic regions with higher observed mutation rates display a higher divergence when compared to the corresponding region in the chimp genome.
These positive correlations were strong, especially the correlation with human diversity, but the authors point out that they’re not as strong as they would have expected if variation in mutation rates were the sole cause of variations in the patterns of diversity and divergence. Both Francioli et al. (2015) and Smith et al. found that accounting for the effects of recombination significantly improved the correlation with diversity and divergence. The latter showed that GC-biased gene conversion (gBGC) at recombination hotspots was causing an elevated number of mutations to G or C to be fixed at these hotspots (reviewed in Duret and Galtier, 2009).
In other words, the relative frequencies of DNA differences among humans and between humans and chimps (and other apes) at different locations in the genome are explained well by observed differences in mutation rates throughout the genome, and demonstrable biasing mechanisms like gBGC. Figure 7 illustrates this concept.
Once again, all this strongly implies that mutations are actually responsible for the observed genetic variation (SNPs) in modern human populations, and were the cause of the fixed differences we see now between human and chimp genomes. If most of the genetic variation in humans was originally created by God in the genomes of Adam and Eve, there’s no good reason to expect that God would have made heterozygous sites in locations in the genome according to what their germ-line mutation rates would be once Adam and Eve got reproduction going. A possible explanation that some YECs might invoke here would be that the heterozygosity is actually driving the mutation rate, but the direct evidence for this is scarce (reviewed in Xie et al., 2016): limited to a single study in plants (Yang et al., 2015), and has failed to be reproduced in a subsequent study in bumblebees (Liu et al., 2016).
Even more striking is the fact that these observed mutational processes account for the fixed genetic differences between humans and chimps. In the YEC conception, the vast majority of these must represent sites that God originally created to be different, and as such there’s no reason to expect that he would originally make humans and chimps (or the ancestors of chimps) more genetically different from each other in locations in the genome that would go onto have higher mutation rates.
Summary and Conclusion
First, we saw that the frequency of ancestral alleles in extant human populations, inferred by referencing our great ape cousins, are consistent with the predictions from classical population genetics based on mutations occurring in a population: the higher the frequency of an allele in humans, the more likely it is to match the inferred ancestral state. Not only that, but looking at a finer scale at different human populations, the slope of this correlation becomes flatter in human populations that are located further from East Africa, consistent with East Africa being the ancestral homeland of all modern humans prior to the successive migration events that spread us around the globe.
Then we looked more explicitly at the mutations, connecting the dots between the relative frequencies of different mutation types at the scale of observed parent-offspring trios today, the same relative frequencies of variant sites within humans, and the fixed differences between humans and our closest relatives, the chimpanzees. The spectrum of different mutation types was consistent between these different scales, strongly implying that the same process is responsible for all three. Since we can be confident that natural, spontaneous mutations are what caused the observed differences in parent-offspring trios, this suggests that the same natural addition of mutations, accumulated over long periods of time, is responsible for both modern human diversity and the differences between humans and chimps. If mutations explain the differences between humans and chimps, then the obvious conclusion is that we share a common ancestor, and subsequently diverged.
Finally, we saw that there is variation in the mutation rate in different regions of the genome. Regions that are empirically observed to have higher mutation rates in humans today correlate with those regions that contain the most genetic diversity within human populations as a whole, and also those regions which are most divergent between humans and chimps. Again, there is consistency between these three scales, indicating that the same natural process of mutations was acting over all of them.
These observations match the predictions that flow naturally from evolutionary theory and common descent. We can explicitly say “if evolution and common ancestry is true, we should observe X”, then gather the data, and find X. On the other hand, these observations are completely unexpected under a creation model, especially a “created heterozygosity” scenario. Creationists have failed to address this evidence, ignoring it altogether when they claim their models are rigorous and even on par with evolutionary theory. Mutations are plainly the cause of genetic diversity and divergence with other species, not an act of divine “front-loading”.
Comments and queries are welcome.
-RM
Footnote: I have to give special thanks to Dr. Steve Schaffner for helping me extract the human SNP counts from the 1000 Genomes data, and for inspiring me to write about mutation spectra after I read his Biologos article on the subject from 2017.

hello Rational…Tommy here…..lots and lots of assumptions, of course… But I enjoyed reading it……but you’ve assumed that its our genetics that separates the two groups (humans and chimps). There is no evidence that the differences in genomes (or specifically SNPs) is what is responsible for the differences in our phenotypes…also there’s the problem that most mutations in humans have happened in the past 5-10,000 years — https://www.sciencedaily.com/releases/2012/11/121129093951.htm
and if that’s the case with humans then there’s no reason to think the same isn’t true with chimps and every other organism. You’ve also assumed a constant rate of mutations, and assumed long ages, which there is no reason to assume. There’s also the problem of environmentally-induced mutations……I think the latest science is showing that the mt dna may very well be the source and cause of most speciation events…either that or epigenetic mechanisms, or alterations in non-coding sequences that alter gene expression.
LikeLike
Hi Tommy, I see you haven’t changed your schtick.
I didn’t actually assume that “it’s our genetics that separates humans and chimps”, just that there are genetic differences between us. I’m sure you wouldn’t disagree with that. This blog post is about the origin of those genetic differences, nothing more. You’ll notice that I didn’t mention phenotypes even once.
It’s not a “problem” that most mutations in humans happened in the last 5-10,000 years. As the second sentence in the article you linked says, this is because the human population began to dramatically increase in size at this time. This is also consistent with what I found in my own analysis, described in this blog post: the overwhelming majority of SNPs are present are at pretty low frequencies in the human population. That doesn’t change the that higher frequency (older) SNPs exist. If you\re trying to make some kind of YEC argument with this paper because you like the sound of “5-10,000” years, I recommend you don’t, because if you actually read the paper (I know you struggle to do this), you’ll find inconvenient facts like the average SNP age being 34,000 years old, and the the oldest SNPs being up to 800,000 years old.
I didn’t assume a constant rate of mutation, in fact I explicitly said at the end of point #2 that mutation rates themselves evolve, and that rates different slightly between even closely related species. I also noted that the degree of this rate change matches the familiar nested hierarchy pattern of the great ape phylogeny.
I didn’t assume “long ages”, but they are a conclusion given the data, because if mutations are responsible for the differences between humans and chimps, then at current mutation rates long ages would be required. To be clear, I’m perfectly on board with mutation rates changing slightly over time, but not by 1000x as required to make YECism plausible. All that being said, there is absolutely good reason to “assume” long ages – even non-YEC creationists like OECs and IDers accept that.
Hand-waving about environmentally-induced mutations, epigenetics, and regulatory mutations is completely irrelevant (although classic Tommy).
LikeLiked by 1 person
you have worked-in assumption that all the variants arose by chance, and that they all evolved….there is no way to place dates on mutations…dna does not come with a birth certificate. I wasn’t trying to make a YEC argument, but it makes no sense that humanity would hang around for 2 million years, never growing in size, only to suddenly explode exponentially and spread across the globe like wildfire. The idea that humanity would stay in one place for 2 million years is unlikely at best, if not impossible,considering our innate desire to explore, migrate, get away from others and learn about the planet.
LikeLike
By any meaningful definition, they do arise by chance, although I didn’t have to assume this. Even if all the mutations in the trios somehow arose from a process other than chance, all that matters is that they remain fairly consistent. It appears that they do, given that different studies find similar mutation rates and spectra.
I didn’t “assume” that all the variants evolved, I concluded that based on the data. Are you sure you read this blog post?
If there’s no way to place dates on mutations, why did you try and reference the results of a study that said most of them were young? If there’s no way to place dates on mutations, then that study was barking up completely the wrong tree and its results are utterly meaningless. By the way, YEC geneticist Dr. Jeffrey Tomkins would disagree with you there, since he said that the study you (indirectly) cited “let the data speak for itself” and “did not apply all of these hypothetical evolutionary constraint to the models”. Those are direct quotes. He specifically praises the paper for their methodology.
Humanity didn’t stay in one place for 2 million years, and the population didn’t “never grow in size”. It’s just that the population was only able to *dramatically* increase in size more recently due to things like agriculture. It’s not really that hard to understand.
LikeLiked by 2 people
Great stuff!
LikeLike
hi evograd. maybe we can explain it without mutations. for instance: say that A will always change into G because it has similar function. so its possible that the designer will made A in chimp where in human it will be G (or vice versa) because in this way even if A will be changed into G because of a mutation, there is more chance that the function that is coded by that gene will be still fine.
LikeLike
Hi evo,
the argument of (ancestral alleles)
doesn’t refute creationists argument( to explain genetics diversity in Africa) wich say that African peoples have more recombination or high mutation rates?
I think creationsts arguments can’t explain why African peoples alleles have more probabilities to be ancestor to Neutral alleles in EU and Asia.
If more recombination in African peoples effects on the whole genome
we shouldn’t see this results
am i true?
many creationsts repeat this argument like SFT and Rob. Carter.
LikeLike