In 2013, a paper was published by researchers from New Zealand in the journal PLOS ONE entitled “Beyond Reasonable Doubt: Evolution from DNA Sequences“. After reading it recently, I was surprised to find that it seems to have flown under the radar in popular science circles. I couldn’t find any references to the article in press releases or even in popular blogs that promote biological sciences and evolution. Perhaps this is the reason that the paper has also gone unchallenged by creationists and ID proponents – it’s never really been used in debates to support common ancestry. Let’s assume that’s the case, after all, it’s completely unheard of for creationists/ID proponents to ignore the best pieces of evidence for evolution, isn’t it? The singular comment I could find by an ID proponent on this paper was a whining EvolutionNews article that didn’t even attempt to criticise or refute the paper’s methodology or results, but instead complained at length about the “sneering tone” of authors. In other words, complaining that evolutionary biologists are so dismissive of ID and creationism. Why might that be, I wonder.
Anyway, that little tangent aside, let’s look at the contents of the paper.
What does the theory of universal common ancestry predict?
As the name implies, Universal Common Ancestry (UCA) is the theory that all extant life on earth shares a common ancestor if you go back far enough. This theory makes several quantitive predictions: trends in data that we really have to observe if UCA really is correct. Among these is the idea of molecular convergence as you go back in time.
In other words, if you could travel back in time, say, 3 million years, and find the ancestors of today’s humans and the ancestors of today’s chimpanzees, you would expect them to be more similar to each other than modern humans and chimps are to one another today. This is because the two independent lineages have been evolving independently since they diverged about 7 million years ago. We expect to find more dissimilarities at the molecular (DNA and protein) level with increasing time since our last common ancestors: we’re more similar to chimps than gorillas, more similar to gorillas than orangutans, and so on.
Of course, we can’t actually go back in time and take DNA samples of our ancient ancestors (although ancient DNA can be very informative), but we can do the next best thing: perform ancestral gene reconstruction analyses. I won’t go into detail about this method in this post, suffice it to say that it’s an accurate method of inferring gene sequences of an ancestor of a given set of extant sequences.
So, the stage is set for a formal test of UCA. It’s possible to take a set of extant species and compare how similar their sequences are, then reconstruct the ancestral sequences and see if these are more similar or not. That’s exactly what White, Zhong, and Penny did in their paper.
Quantifying convergence between large taxonomic groups
As you can see in Table 1, White et al compared a wide variety of taxonomic clades with divergence times ranging from 80-700 million years ago. The reason for this wide-ranging dataset was to demonstrate that the molecular convergence was a trend found at all different levels of ancestry, not that just some groups converge while others appear to have independent origins. This is why the results speak to universal common ancestry, not merely ancestry between particular groups. A number of species within each clade were chosen to give a good representation of that clade – for example 25 species of Angiosperms. Gene sequences for a number of chloroplast, nuclear, or mitochondrial genes were obtained from existing databases.
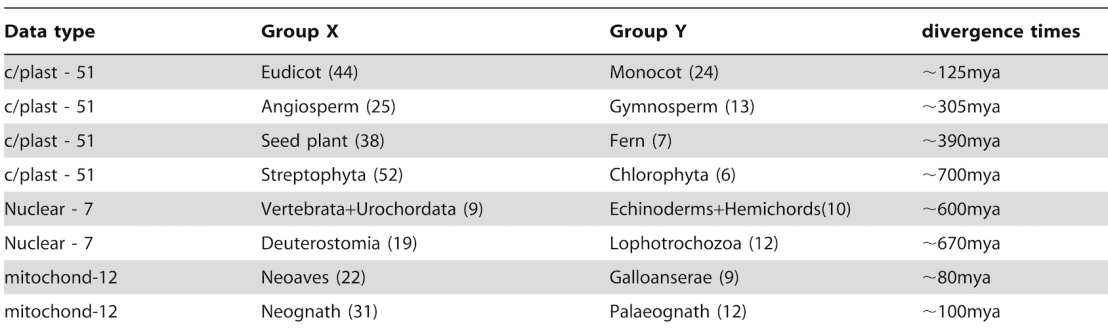
So, remember the procedure: first, the similarities between genes from species in a pair of these extant groups were calculated on the basis of alignment score, for example Angiosperms (AS) and Gymnosperms (GS). This was done by comparing each individual in the AS to every other individual in the GS, and essentially taking an average.
Next, the ancestral gene reconstruction was performed on each group, so they ended up with a single sequence for each gene, one ancestral to the AS and one ancestral to the GS. Again, the similarity between this pair of ancestral sequences is calculated. If the pair of groups are related, these ancestral sequences should be more similar than the average of the extant sequences. If the groups are not related, which would correspond to some of independent origin, such as special creation, we should expect to find no significant different in the level of similarity. This principle is illustrated in Figure 1.
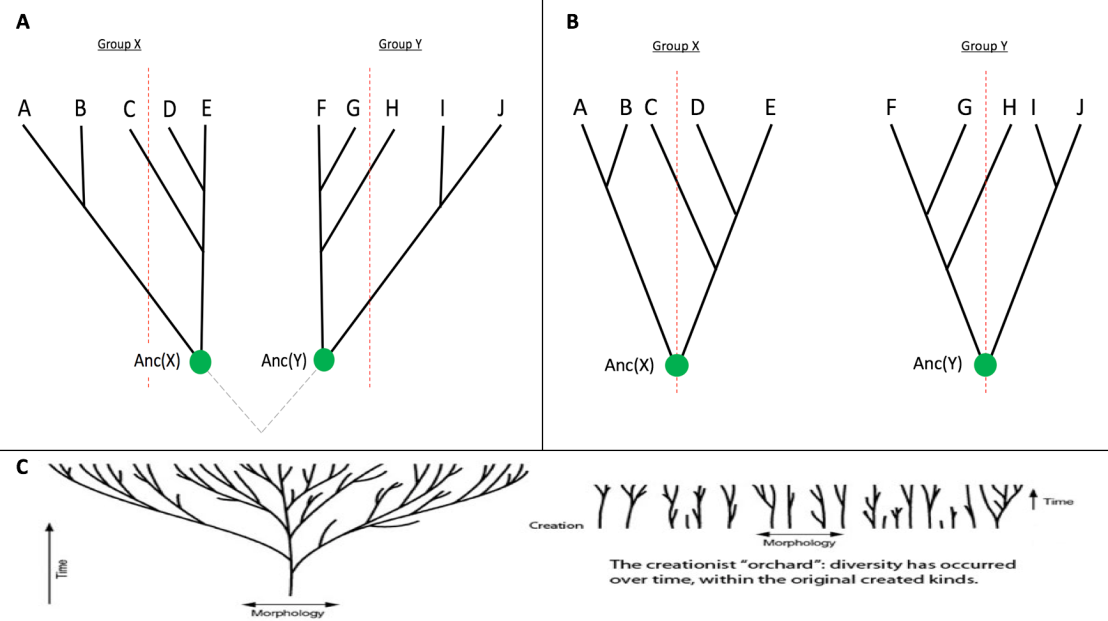
As you can see, the illustrations of the predictions from the different models in Figure 1A) and 1B) match perfectly with the illustration given by creationists for the competing models in 1C). The branches point straight down towards the creation event, while in the UCA tree the branches are oriented such that they converge as you move further down the tree. The only difference between the diagrams is that the one from creation.com is drawn in morphological space, while A) and B) are drawn in sequence space, but the principle remains the same.
In Table 2 of the paper the significance values for each of the pairwise tests are shown, and they’re all highly significant, ranging from 1.05×10⁻⁶ to 1.69×10-44. For the combined dataset as a whole, the P-value is 2.59×10-132. The ancestral nodes are more similar to each other than the extant sequences by a huge margin of significance. That means the odds of the observed convergence occurring by chance are infinitesimally small. Appropriate null controls were run to justify the conclusion that convergence is a product of common ancestry.
While it wasn’t the focus of the paper (or this blog post), the authors also comment that the fact that greater convergence is correlated with the length of the gene in question is consistent with the stochastic nature of substitutions in evolution. They also found that the significance of the convergence correlated with the number of genes used, so using an expanded dataset of genes is likely to produce even more confident results in a similar analysis.
Pre-empting creationists
I just want to re-emphasise: the ancestral sequences of groups X and Y were reconstructed completely independently, and only compared at the very end of the process. There was nothing about the methodology that “guided” the ancestral sequences to be more similar than the extant ones.
Since the results are unassailable, the only option creationists have is to take issue at the basic methodology – the reconstruction of ancestral gene sequences. They might argue that such a reconstruction inherently assumes that a group like Angiosperms have a common ancestor in the first place, and that there weren’t multiple independent lineages within these large groups. Don’t worry, the authors already thought of that, so they made sure to take this possibility into account. The null model which the results were compared to made absolutely no assumptions about the groups, other than the fact that the groups themselves were unrelated. They explicitly allowed for all of the taxa within each group to be unrelated as well. To quote the paper:
Our null model can be considered in the following way – that the taxa in subgroup X are descended from an unknown number 1< = rX< = |X| of root sequences, the taxa in subgroup Y are descended from an unknown number 1< = rY< = |Y| of root sequences, and that the rX+rYroot sequences are all independent from each other. This allows, at one end of the spectrum, the possibility that all |X|+|Y| taxa were independently created, and at the other end of the spectrum, the possibility that all taxa in one subgroup are descended from a single common ancestor for that subgroup, which was created independently of the single common ancestor for the other subgroup. In other words, this null model imposes no requirements on the presence or absence of internal (within-subgroup) evolution of the two subgroups of taxa; the only constraint is that there is no evolutionary link between the two subgroups. That is, neither subgroup contains taxa derived from the other, nor from a common ancestor.
When combining the dataset as a whole, they also made sure that the same pairwise relationships were recovered. To put it another way, they made sure that each of the groups was actually being compared with its “true” sister taxa, i.e. that Angiosperms were still more similar to Gymnosperms and not, say, Streptophyta. This is further evidence that the groups were real – to quote the paper again:
It is important to demonstrate that the two subgroups or clades (X and Y) are genuine, and we do this for each of the subgroups in Table 2 in two ways. Firstly, the two subgroups are determined by other data – for example by nuclear or by mitochondrial DNA sequences for the plant chloroplast data. Secondly, for each of the eight pairs of datasets in Table 2 we later combine the two datasets, and confirm that the same two subgroups are still found – for example, the monocots and eudicots. This independent selection of the two subgroups is necessary because if, for example, we formed one subgroup by randomly selecting half the monocots and half the eudicot sequences, and used the other taxa to form the second subgroup, then we could artefactually get similar ancestors. So both tests (selecting subgroups from independent data, and later showing that the subgroups are recovered with the data used) are important in demonstrating that the subgroups X and Y are natural.
Next, creationists might try to argue that ancestral gene reconstruction is inaccurate, therefore the results can’t be relied upon. I already cited a paper demonstrating how accurate the methodology is (as do the authors of the paper), but does that really matter? Even if we assume for a moment that all the ancestral gene reconstructions could be wrong, that still doesn’t explain why they would result in the obscenely significant convergence that the authors observed. As I said before, there is nothing inherent in the method that would bias it to making the ancestral genes in two or more completely independent analyses more similar, so this argument leads to the inevitable claim that the results of this analysis were just a lucky result, despite the odds against that being 2.59×10132 to one. An infinitely more likely explanation is that the ancestral gene reconstruction was accurate, and the results reflect the fact that universal common ancestry is true.
Summary
In their paper, White and colleagues lay out a rigorous quantitative test of a fundamental prediction of the theory of universal common ancestry. Such formal tests have been attempted previously, but this is by far the most simple and elegant one that I’ve come across. The paper has been favourably mentioned by several other publications on the subject of testing UCA, including those which have offered in-depth critiques of previous attempts. I’m surprised this article has managed to fly under the radar for the last few years in the evolution/creation “debate” circles, so I hope that this blog post might help to elevate its profile just a little.
Comments and queries are welcome.
-RM

hi evograd. im not sure that i got the idea (maybe because of my english). are they saying that as far as we go back in time the genomes between 2 species will be more similar? isnt it similar to this paper:
https://www.nature.com/articles/nature09014
LikeLike
Yes, the gist of the paper is that as you go further back in time following 2 lineages, their genomes will be more similar if they diverged from a common ancestor. They found that as they went further back, the sequences they compared were more similar, indicating common ancestry between those groups.
Their methodology and rationale quite different to those in Theobald’s paper.
LikeLike
ok. but how is that different from a designer perspective? isnt the design scenario predict the same thing? take a cat and a dog for instance. according to the design scenario they were more similar in their past since they got many mutations since their creation.
LikeLike
They would have experienced mutations since creation, but why would those mutations make them diverge more than they already were at creation? What basis do you have to expect that the original cat and dog were more genetically similar to one another than modern cats and dogs are now?
One of the things they show in the paper is that unrelated proteins don’t show this convergence as you “go back in time”, while related ones do. If I generate 2 random (unrelated) starting sequences and mutate them both randomly to end up with 2 slightly different final sequences, those final sequences will not be more similar to one another than the 2 starting sequences were. The mutations happened randomly, some making the sequence more similar to the other, others making them less similar. The net result is no difference.
Remember that they weren’t just comparing single species either, they tested a range of different taxonomic levels and found the same pattern in each case.
LikeLike
its true that we will not get more similar sequences during the time if we are talking about random sequences (unless we are dealing with hot spots or convergent evolution). but if we start with 2 similar sequences we should find that during the time they will be more different. so if we take a globin sequence of cat vs dog in their creation it was very similar (say 95% similalrity) and during the time it get less similar since it got mutations (so now its about 90% similar). so im not sure that i got the idea. also: what do you mean by “unrelated proteins”?
LikeLike
Why would you think that the globin gene of the original cats and dogs were so similar? And why would (to continue this analogy) would the globin genes of cats and dogs have been more similar to one another than they both were to, say, the globin gene of horses? The fact that this pattern is observed at a range of cladistic levels is important. To quote the paper:
“Early (pre-Darwinian) biologists suggested several ideas as to the relationship of modern organisms, but a relevant one here is the ‘archetype’ model [25] that suggested that a number of ‘forms’ were originally created within high-level groups. For mammals say, one ‘form’ would have been a giant cat, which then independently evolved (or degenerated) into lions, tigers, leopards, panthers, cheetahs, etc. In our examples, this is tested (and eliminated) by demonstrating that successively deeper datasets continue to show ancestral convergence. In other words, we do not see a set of ‘archetype’ species originating at just one point in time – there is continuity in the evolutionary process.”
Unrelated proteins refers to proteins that don’t share ancestry, the alternative being proteins that are paralogs, for example.
LikeLike
“Why would you think that the globin gene of the original cats and dogs were so similar?”
because they are already very similar. so of course that if we will go back in time they will be more similar and not more different. and why this globin is more similar between cats and dogs then to the horse globin is because horse is more different. so bascially a creature (in general) that is more similar in its morphology will be also more similar in its genetic.
LikeLike
Why couldn’t the original animals have been just as different to one another as the modern ones are? And your answer on the question of the multiple levels that this divergence holds at is the same fallacious reasoning that YECs use to hand-wave away phylogenetic in general: the idea that morphology should correlate with molecular sequence differences. But there’s no reason to think that cats and dogs require more similar globin genes than a horse does. It’s not as though that particular globin sequence is functionally tied to the morphological differences between cats and dogs.
LikeLike
“Why couldn’t the original animals have been just as different to one another as the modern ones are?-
because they got many mutations over time. so of course that they will be more different during the time rather then more similar or the same.
“But there’s no reason to think that cats and dogs require more similar globin genes than a horse does.”-
actually we do. cats and dogs have similar size, similar diet etc. they share more traits with each other then with horse so its possible that at least several of these traits have a connection to their oxygen requirements.
LikeLike
“because they got many mutations over time. so of course that they will be more different during the time rather then more similar or the same.”
I was more thinking about the amount of time elapsed and how many mutations would have actually accumulated since creation. If we consider just the beta-globin gene as an example, the coding sequence is approximately 500bp long, and if we assume the mutation rate in cats and dogs is around the mammalian average of 2.2×10^−9 mutations per base pair per year, there’s only a 1 in 151 chance that a single base would have been mutated. Comparing the modern cat and dog beta-globin sequences, there are more than 50 single nucleotide mutations separating them. This problem is what’s caused YECs to recently come up with the whole “created variation” nonsense, which only furthers muddies the waters as to what YECism would predict the results of this “convergence test” to be.
“actually we do. cats and dogs have similar size, similar diet etc. they share more traits with each other then with horse so its possible that at least several of these traits have a connection to their oxygen requirements.”
If those are your only criteria then phylogenetic trees (and this analysis) should always return results more consistent with physiology rather than actual phylogeny. You should also bear in mind that most genes don’t function as simply as globin genes – they don’t have functions that you could easily associate with physiology in this way. Look at the dataset in the paper. The didn’t use globins, they mostly focused on chloroplast and mitochondrial genes including rpoB (an RNA polymerase) and ATP synthase subunits. Good luck correlating the function of these kinds of genes to physiological traits like size or diet.
LikeLike
here is my last comment here :
as for the time- i agree that it doesnt fit naturally with a young earth (unless we will claim for higher mutation rate in the past). but it will be possible with an old one.
as for the second claim: there are many cases of convergent evolution at the molecular level. even if we are dealing with traits that are suppose to be morphology- neutral (mitochondrial proteins):
https://www.ncbi.nlm.nih.gov/pubmed/19416880?dopt=Abstract&holding=npg
so i think that they are not morphology neutral after all (its also happened in 2 close species).
LikeLike
“as for the time- i agree that it doesnt fit naturally with a young earth (unless we will claim for higher mutation rate in the past). but it will be possible with an old one.”
It would be “possible” in an old earth scenario with a few single comparisons, not on multiple taxonomic levels as the paper points out. The crux of the conversation is this second part.
“as for the second claim: there are many cases of convergent evolution at the molecular level. even if we are dealing with traits that are suppose to be morphology- neutral (mitochondrial proteins):”
Yes, molecular convergence exists, although cases like this are pretty rare. However, it’s still true that those mitochondrial genes are “morphology-neutral” – the hypothesised shared adaptive pressures that led to convergence in this case would be metabolic, not morphological. That should be obvious anyway: snakes are quite morphologically distinct from agamids. It’s also clear that this is a case of convergent evolution, not likely to be the result of some kind of design plan. The paper shows that 4-fold degenerate sites, those least susceptible to selective pressures, are not convergent between the 2 groups, and instead support the expected phylogeny. This is a key signature of molecular convergence: the neutral sites fit the expected phylogeny while the adaptive sites do not.
It would be interesting to see how a case like this would look after being analysed using the method in White et al.’s paper. The prediction from the traditional phylogeny, common descent, and convergent evolution is quite simple: as you go further back in time (to a point), the snake and agamid sequences should *diverge* instead of converging. At the same time, the agamid sequences should converge with the iguanid lizards.
(The discussion was continued here: https://discourse.peacefulscience.org/t/the-genetic-code-and-universal-common-ancestry/5514/193)
LikeLike